Progress Mapping: How maps are improving government accountability in Liberia’s cities

As a country that has endured two civil wars in the past 28 years, Liberia and its citizens are all too familiar with what can happen when government is not inclusive of, and responsive to, the needs of all citizens. As the country continues to make strides in strengthening its governance, it has begun to tackle its historically centralized, top-down approach to governance. With most government services and administration based in the capital, Liberians living outside of Monrovia can find it challenging to access some basic services, or feel heard in decisions about their own governance. To help amplify these voices and bridge these gaps, USAID launched the Local Empowerment for Government Inclusion and Transparency (LEGIT) project in April 2016.
Two of LEGIT’s primary aims are to increase citizen representation in local service delivery, and to improve Liberian cities’ ability to deliver those services. Why does this matter? Liberia has a long history of governing from Monrovia. In practice, this means that the simplest of administrative tasks can become a bureaucratic odyssey for someone living outside the capital. Say, for example, you want a driver’s license, and you live in Gbarnga, one of Liberia’s largest cities. First, you will first need to travel 120 miles to Monrovia to visit the Ministry of Transport. Then, once you’ve dropped off your application, you will be asked to return in three days to pick up your license, and make the journey back home only to turn around in three days and hope the license is ready. For a country where the average GDP per capita is $900[1], these bureaucratic hurdles are not just inconvenient, they are expensive.
Before USAID could embark on helping Liberia strengthen access to local services, we first had to answer a critical question: “Where do things stand now?” Enter the Humanitarian OpenStreetMap Team (HOT), one of our key partners in the LEGIT program. HOT works with communities around the world to develop maps that support social and economic development. For those of us who are used to pulling up Google Maps on our iPhones and navigating from Point A to Point B with relative ease, it is easy to underestimate the importance of this exercise.
The city of Ganta, for example, is Liberia’s second most populated city. It has a population of over 40,000, a vibrant market center, and, from its incorporation in 1975 until the HOT/LEGIT mapping exercise, did not have an official map demarcating its city limits[2]. In Zwedru, the only city map local officials could point to was hand-drawn, tattered, and outdated. In some of the more remote suburbs of these cities, our mapping partners had to rely on local knowledge of routes to reach communities, because there were no marked roads or signs. A resident of one village told HOT that during the rainy season, her village was completely cut off from neighboring Zwedru city.
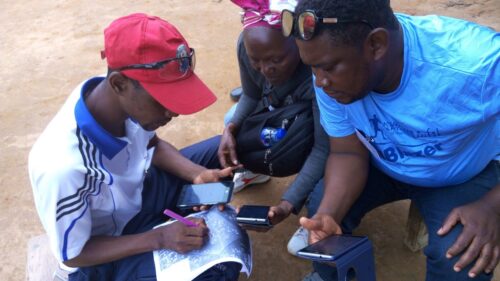
From April to July 2017, HOT and LEGIT partnered with the Liberia Institute of Statistics and Geo-Information Services (LISGIS), Liberian city staff, and various civil-society organizations (CSOs) to launch an ambitious mapping exercise across Zwedru, Gbarnga, and Ganta cities. These exercises included: 1) training CSOs and city staff in mapping, mobile data collection, and HOT’s mapping system; 2) mapping key city infrastructure and services; and 3) mapping or improving city administrative boundaries. While mobile phone usage is on the rise in Liberia, for some participants, it was the first time they had used a mobile phone or computer. After these trainings, the teams hit the road. Each city team spent a total of fifteen days identifying streets, businesses, water points, health facilities, schools, and all other buildings within their city’s limits. They took the exercise one step further and ventured outside the city limits to reach remote communities, some of which were completely unknown to government officials.
By the end of the exercise, HOT, LEGIT, and our partners mapped 52,730 buildings; 4,732 water points; 10,115 toilets; 380 educational facilities; 181 health facilities; 3,382 shops; and over 18,000 overall amenities. For the first time, citizens and local officials alike can pull up the HOT website on their laptop or phones to view these maps.
So what do toilets, water stations, and health facilities have to do with strengthening local governance, accountability, and self-reliance?
For citizens living outside Monrovia, it means having an accurate idea of what services are available to them in their communities. Investment in technology provides an accountability tool they can use to assess any gaps between what their local leaders have promised and what they have actually delivered. For the local governments themselves, it means they now have a tool to identify where there are gaps in critical public services. Before these maps, local governments could not, for example, easily pinpoint which communities were cut off from public health or sanitation facilities. According to one government official, “This…will benefit the city because we [now] know where there is safe drinking water, where there are schools…and major facilities. My organization can use this report to carry those facilities to places that are lacking.” Lastly, for USAID and our partners, it means we have a clear picture of where things stand now, which enables us to be more efficient and strategic in targeting our assistance to help citizens and their local representatives close gaps in service delivery.
Ganta, Gbargna, and Zwedru are thriving cities that will continue to grow. Because we worked so closely with local organizations and representatives, USAID and its partners are excited to watch these maps evolve as cities increase the number of services available, and local residents update these maps. Follow along with us at the Zwedru, Gbarnga, and Ganta maps!
By Aissata Traore, Project Associate for LEGIT at DAI (Development Alternatives Incorporated)
[1] https://www.cia.gov/library/publications/the-world-factbook/geos/li.html
[2] http://www.emansion.gov.lr/doc/census_2008provisionalresults.pdf

